
Stock Price
Displays the current stock price of a company.
Using the Stocks widget, you can show the current stock prices of your favorite companies on your dashboard. The widget prioritizes the symbol, current price, and trend. Company name, change, time range, and a taller chart appear progressively when both widget dimensions can support them.
In advanced view, the widget always shows the returned symbol and company name, configured range and interval, current and previous close, absolute and percentage change, range minimum and maximum, and the full price-history chart. These values use the same configured Yahoo Finance query as the compact widget; advanced view does not change the symbol, range, or interval.
Screenshots
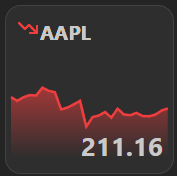
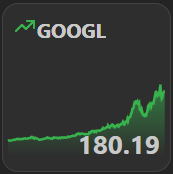
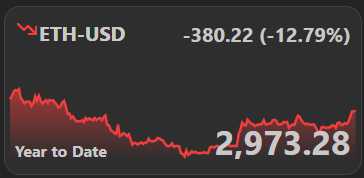
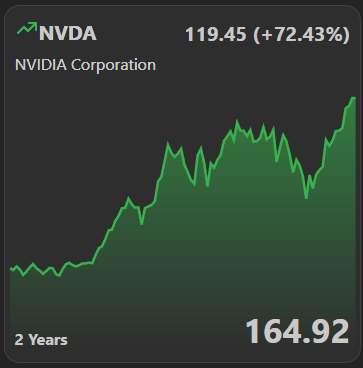
Supports advanced view. See the advanced keyboard shortcuts.
Adding the widget
Add the widget from the board's Add board content menu in edit mode.
Configuration
| Name | Description | Values | Default value |
|---|---|---|---|
| Stock symbol | The stock symbol of the company you want to track | List of URLs | AAPL |
| Time Range | Time range of the diagram |
| 1 Month |
| Time Interval | Interval between data points |
| 1 Day |
Examples
Here's a small collection of examples, that you can use for testing or actual use (in no particular order):
- AAPL
- GOOGL
- AMZN
- TSLA
- MSFT
- META
- NVDA
- NFLX
- BTC-USD
- ETH-USD
Data source
We use the Yahoo Finance API to fetch the stock prices.
If you need to whitelist the api, please use the following URL: https://query1.finance.yahoo.com