
Beszel Systems (Grid)
System Monitoring
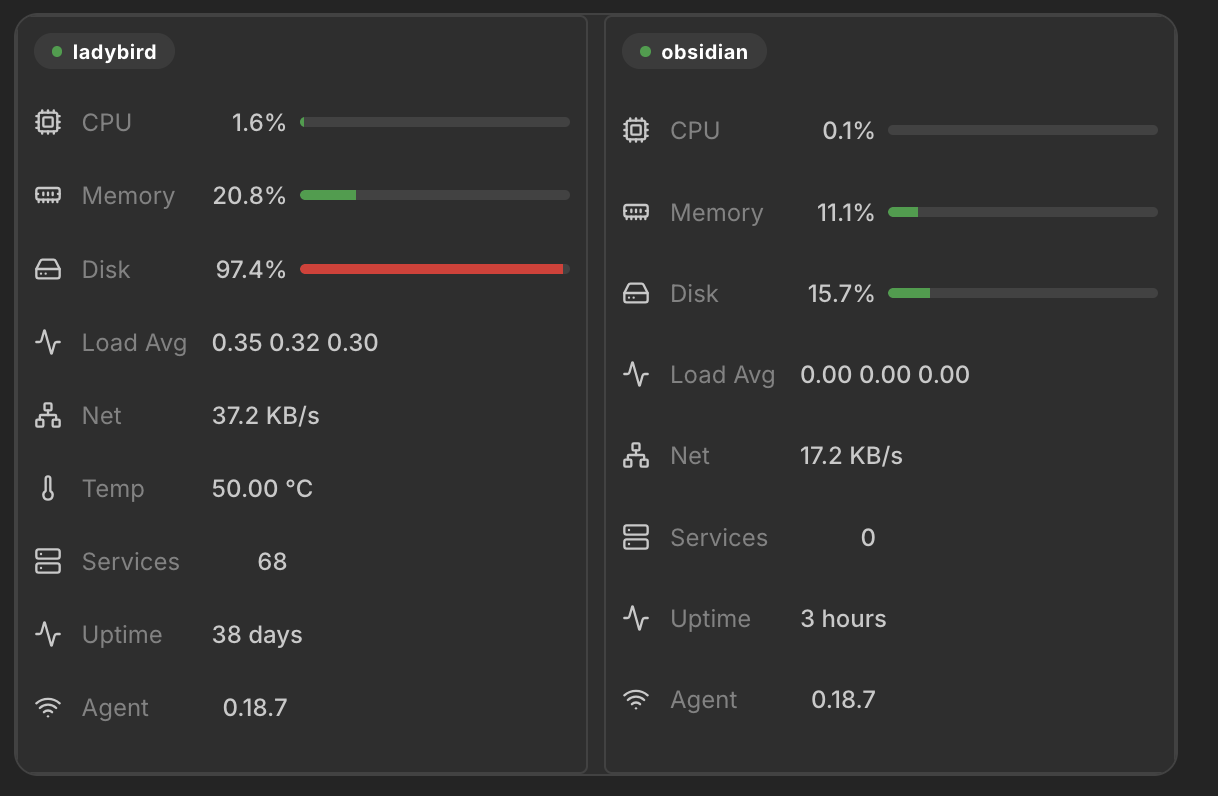
Card grid view of all Beszel-monitored systems with real-time metrics.
This widget displays all your Beszel-monitored systems as a responsive card grid. Each card shows real-time metrics like CPU, memory, disk, network, temperature, and more. Resizing the widget adjusts its rows and columns to keep the cards balanced. If Beszel reports multiple filesystems, the disk bar exposes a hover breakdown for the root disk and each extra mount.
Select a system card to open the complete statistics view, including system, filesystem, Docker, historical, and realtime charts.
Screenshots
Supported Integrations

BeszelBeszel is a lightweight server monitoring platform with Docker stats, historical data, and alert functions.Displays all monitored systems as a card grid
Adding the widget
Add the widget from the board's Add board content menu in edit mode.
Configuration
| Name | Description | Values | Default value |
|---|---|---|---|
| Status filter | Filter systems by their current status |
| All Systems |
| Show CPU | Displays CPU usage on each system card | yes / no | yes |
| Show memory | Displays memory usage on each system card | yes / no | yes |
| Show disk | Displays disk usage on each system card | yes / no | yes |
| Show GPU | Displays GPU usage on each system card | yes / no | yes |
| Show load average | Displays system load average | yes / no | yes |
| Show network | Displays network throughput | yes / no | yes |
| Show temperature | Displays system temperature | yes / no | yes |
| Show battery | Displays battery level (if available) | yes / no | yes |
| Show services | Displays running Docker services count | yes / no | yes |
| Show uptime | Displays system uptime | yes / no | yes |
| Show agent version | Displays the Beszel agent version | yes / no | yes |