
System Health Monitoring
Displays information showing the health and status of your system(s).
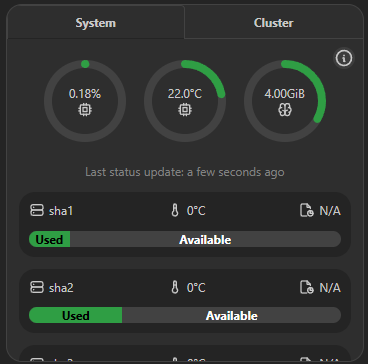
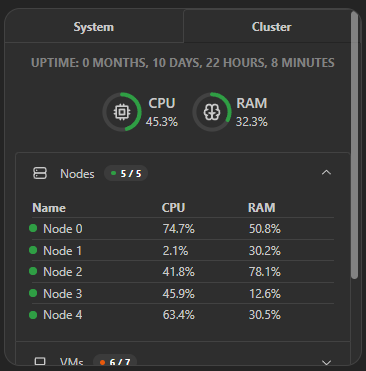
This widget displays information about the health and status of your system(s), including CPU, memory, disk usage, and more.
CPU usage, CPU temperature, memory usage, and GPU utilization are shown as compact gauges with threshold colors and their original units.
Advanced view is a complete health workspace: it shows every available CPU, temperature, memory, GPU, filesystem, update, reboot, and system-information section even when compact visibility switches hide some of them on the board. Proxmox clusters likewise show uptime, CPU, memory, and every node, VM, container, and storage section. Storage-volume filters, units, and permissions remain in effect.
Screenshots
Supported Integrations






Supports advanced view. See the advanced keyboard shortcuts.
Adding the widget
Add the widget from the board's Add board content menu in edit mode.
Configuration
| Name | Description | Values | Default value |
|---|---|---|---|
| CPU Temp in Fahrenheit | Display the CPU temperature in Fahrenheit or Celsius | yes / no | no |
| Show CPU Info | Displays CPU info in the system tab | yes / no | yes |
| Show Memory Info | Displays memory info in the system tab | yes / no | yes |
| Show Uptime | Show uptime in the cluster tab | yes / no | yes |
| Show Filesystem Info | Displays filesystem info in the system tab | yes / no | yes |
| Visible storage volumes | Only available when all selected integrations are Synology. Leave empty to show all detected storage volumes. | List of storage volumes | Empty list |
| Default tab | Tab that should be visible by default. Only used when multiple integrations are available. |
| System |
| Visible cluster sections | Select which sections should be visible in the cluster tab | List of Nodes, VMs, LXCs, Storage | Nodes, VMs, LXCs, Storage |
| Section indicator requirement | 'All' requires that all items be online for the indicator to be green. 'Any' requires at least one item to be online. |
| All |